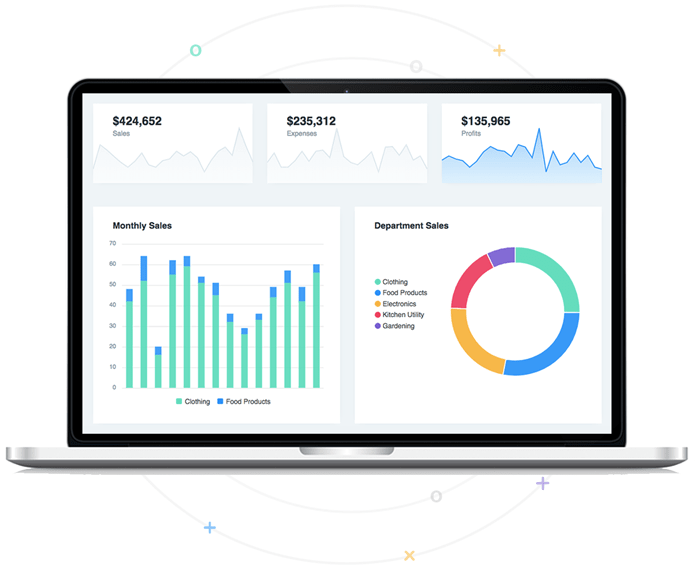
In fact, an aesthetically pleasing chart or graph can enhance the design of a website or application. Every organization needs to see real-time data quickly to make better business decisions at the right time. Therefore, the developers work hard to create an efficient dashboard that can showcase data clearly. And including colorful charts and graphs of different types makes the task easier to represent data in the best way. This can help differentiate data with shapes, sizes, etc., and make it more attractive. Hence, many enterprises want to develop such dashboards for their applications and sites. If you are looking for the best libraries to develop beautiful dashboards for your applications, this article is for you. Let’s understand the proper approach to doing this by understanding some key concepts. I’ll also help you choose the best charting libraries for your next design session.
What is JavaScript?
JavaScript is a scripting language used both on the server-side and client-side that lets you design an interactive web page. With this programming language, you can implement complex features and great functionalities, such as interactive maps, scrolling video jukeboxes, animated graphics, content updates, etc. JavaScript is used by many developers across the globe to build interactive and dynamic web content like browsers and applications. This programming language is also great at helping you achieve good results with a few lines of code. You can also add special effects to your applications or web pages easily.
What is a JavaScript Library?
JavaScript libraries are pre-written pieces of code that you can use while building web-based applications, especially for web-centric technologies and AJAX. It will make programmers’ work a lot easier and less time-consuming since they don’t have to create the code from scratch. In simple words, programmers create a library of many frequently used codes so that other programmers can use the same code to build their JavaScript-based applications and their functionalities. Example: Dojo, MooTools, Prototype, jQuery, and YUI are the popularly used libraries for JavaScript libraries.
Why are Libraries so Popular in JavaScript?
The demand for JavaScript is expanding since it can be used easily to produce a dynamic interface in less time. Libraries were developed to help developers concentrate on adding new things without wasting time writing the code from the start. JavaScript Libraries make application and website development easier with their various functionalities and features. A lot of developers use this technique to build awesome applications and functionalities. Let’s understand why libraries are so popular in JavaScript.
Saves Time
If you get a pre-built structure of a house like its base foundation, pillars, etc., the only thing you have to think about is the interior design of the house. Sounds easy, right? Libraries work in the same manner. If you think of creating some new features or adding some new functionality to the application, you do not need to write the code from the beginning. From the libraries, you will get the base that you want. Thus, you can save your valuable time without wasting it writing the code from scratch, which takes significant time in development and testing.
Saves Efforts
The reason is that developing a code that works what it’s meant to do is not easy. It involves plenty of brainstorming, writing, and testing before approval. But when you get the pre-built code for a particular feature from the library, you do not have to do extra labor in writing the whole thing. Developers find this way effortless and like taking this approach to save their energy crafting wonderful applications laced with awesome features. Since JavaScript is an essential part of modern development, developers have a lot of options for building interactive and scalable applications. This is how libraries can save the efforts of many developers and motivate them to do more, which is beneficial for both businesses and individual developers.
Enhances Productivity
Enterprises or large businesses focus on their productivity while maintaining quality. Having said that, productivity im[roves when people can do more in less time and with ease. So, when libraries save developers’ time and energy, they indirectly help developers increase their productivity. They can build more quality applications in less time, which helps businesses accelerate their production and release products to meet their customers demands.
A variety of options
You can find libraries in different languages apart from JavaScript. JavaScript is one of the most used programming languages across the globe. Given its popularity and usage, many developers have contributed to building excellent libraries in JavaScript that are suitable for a variety of purposes. You can add features like maps, charts and graphs, dashboards, chatbot, analytics, and more using JavaScript libraries. Hence, you have plenty of options to choose from for your projects. Now, let’s talk about some of the best JavaScript libraries to add charts and graphs to your applications and sites.
FusionCharts
Build a beautiful mobile and web dashboard with FusionCharts’ responsive and interactive charts, consistent API, cross-browser support, and extensive documentation. Whether you choose simple or complex data for your application dashboard, FusionCharts has your back. You will also find domain-specific charts, such as Spider Charts, Marimekko Charts, Heatmaps, Gauges, Gantt Charts, Waterfall Charts, Treemaps, and more. Start building your next dashboard easily with a variety of charts for your site, including bar, pie, area, line, and column. In addition, FusionCharts offers more than 2000 choropleth maps across various cities and countries. You will get time series charts to view thousands of data for the IoT Applications. You can also design your own theme or choose from templates to have a consistent feel and look. It is pre-integrated with Javascript libraries and various backend programming languages. Get started quickly with the source code and build industry-specific dashboards for your business.
Chart.js
Get flexible and simple JavaScript charting for your application dashboard with Chart.js. Chart.js is an open-source platform that provides eight different ways to visualize your data. Each of them comes with a customizable animation option. You can also resize or redraw charts on windows for perfect granularity without disturbing anything. With Chart.js, you will find never-ending benefits, such as:
Scale staking: Build layout boxes or bars that can be weighted and stacked in groups. Subtitle plugin: You will get a subtitle Plugin option along with your main title. You will enjoy the same options as the main title. Line segment styling: Define your own criteria based on the line segments to be used in the charts. Advanced animations: You can add and configure your own animation individually for each element. Use the transitions independently to differentiate between each criterion. Performance: Use a decimation plugin to add millions of performance points to draw lines between them. IT will help you know how it looks when the performance of a certain application varies. Mixed chart types: You will be able to distinguish between the data sets with the help of a mix and match line and bar charts. It provides a clear visual or comparison between the previous and recent data sets. New chart axis types: Plot sparse and complex datasets on custom scales, logarithmic scales, date-time sets, etc., with ease. Animate everything: Add data sets, update colors, and change data according to the application performance or other basic criteria to animate everything. This will look cool on your site or application and entice visitors.
Highcharts
Experience the flexible and rock-solid charting library for your applications dashboard with Highcharts. It comes with various tools that you need to build secure and reliable data visualizations. Highcharts is built on TypeScript and JavaScript. Its charting libraries work with the server stack or backend database. You will get wrappers for the most famous programming languages, such as Python, Java, R, PHP, and .Net, and frameworks like Vue, React, and Angular. Combine your application dashboard with Highcharts Maps, Highcharts Stoick, and Highcharts Gantt to display various information. You can also implement a general timeline or interactive stock charts and visualize Gantt charts clearly. Take the benefit of the Highcharts Advantage option to get premium entitlement and support to all the release charts. Highcharts can also identify and solve different problems to get better results.
Victory
Get React.js components for data visualization and modular charting with Victory. This library is fully overridable, opinionated, and is an ecosystem of composable components. You will get robust charts, such as scatter plots, area charts, and Voronoi polygons for your complex charting. Victory is a flexible platform for building your application dashboard and provides fully reusable and contained data visualization elements to create your own behaviors and style. Furthermore, you can extend your experience on iOS and Android platforms with the help of an identical API. You will also get a wide range of options for your dashboard, such as custom charts, brush and zoom options, custom components, tooltips, animations, and events.
Chartist.js
Chartist.js offers simple responsive charts for your application dashboard. This is not just a charting library, but it is a product that offers unique options that simple libraries will not. The tool will help you kickstart your development of a dashboard by using stunning templates and beautiful chart styles. Get unique templates like material dashboard pro, material dashboard pro-Angular, and light bootstrap dashboard pro React. Chartist.js offers great flexibility and handling while styling with CSS and controlling with JS. You will get the option of SVG usage, which is the future of the web. It is a DPI-independent and fully responsive platform. Moreover, Chartist.js provides customizable and pre-built templates for you apart from a responsive configuration. It supports various browsers, multi-line labels, advanced CSS animations, SVG animations with SMIL, and responsive options.
Recharts
Build your application dashboard with a composable library of charts built on React components with the help of Recharts. It offers top SVG elements that are built with a lightweight dependency on the D3 submodules. Use the components according to your style and customize the chart to make it stunning. Install the v2.1.9 now and experience a better charting module for your application. You will get various charts, such as Area Chart, Bar Chart, Line Chart, Radial Bar Chart, Pie Chart, Composed Chart, Sankey Chart, Treemap, Funnel Chart, and more. Apart from the above charts, you will also find cartesian components for your charts like cartesian axis, cartesian grid, reference line, reference dot, reference area, error bar, and more. Choose from various polar components, including Pie, Radar, Radial bar, Polar angle axis, Polar Grid, Polar radius axis, etc. You can also use shapes like curves, crosses, dots, polygons, rectangles, and sectors to provide a better view of your charts. Furthermore, you will get general components like text, cell, label, label list, customized option, responsive container, legend, etc.
Google Charts
Display live data on your website or application with Google Charts, which provides simple to use, free, and powerful tools. IT comes with a rich gallery of data tools and interactive charts to build dashboards. Whether you need a simple scatter plot or a hierarchical treemap, Google Charts have a wide range of charts for you. Find the best fit for your use and make your dashboard unique. You can customize every criterion of your charts according to your choice to perfectly match your thinking. Configure the extensive set of tools to get the real feel of your application dashboard. Google Charts is compatible with cross-browser and portable with cross-platform to new Android and iOS releases, which means you do not need any plugins to take out the action. You can also connect controls and charts to the interactive dashboard easily. Moreover, you can connect your data via a variety of protocols and data connection tools. Use all the Google Chart tools for free, and get the guarantee of backward compatibility.
C3.js
C3.js is a D3-based reusable library for various charts that can make your work easy by wrapping the code needed to construct the complete chart. No need to write D3 code anymore; you can define your custom styles according to the class to differentiate between various data. Extend the whole structure by D3 directly. C3 offers classes to every element when you generate charts. It also offers a wide range of callbacks and APIs so that you can access all the variations of the charts. With the use of controllable elements, you can update every chart even if it is rendered already. You can also integrate your charts into the application easily. C3 supports modern browsers with D3 compatibility. You will get different styling, coloring, and shape options for a perfect flow variation. It will also make your visualization and understanding easy. Install C3.js now and enjoy the rest.
Dash
Dash applications can go in every narrow path where traditional apps can not. It is the new approach to data science and AI apps. Dash offers object detection, NLP, predictive analytics, and more. Build your application dashboard with a few lines of Python code. Iterate the same on your workstation or laptop until you are ready to deploy to production or UAT. Learn its best practices, take a demo, and communicate with its exports to dig deeper. Get advanced analytics like ML, computer vision, forecasting, and more, to deliver dashboards quickly. Without taking any help from DevOps or the IT team, you can directly update the Dash apps of your own and move your deployment journey faster. Create perfect web apps and dashboards without writing any codes and scale efficiently with the stateless design. Dash supports critical Python applications and is again an open-source platform or standard that gives you the best out-of-the-box functionality.
ApexCharts
Get interactive and modern open-source charts with ApexCharts and start building your application dashboard in less time. ApexCharts partners with Infragistics, which is the creator of the best data grids on this planet. Ignite UI grids can now handle unlimited rows and columns of the data. It also provides access to real-time data updates and custom templates. The grid is now available in your favorite frameworks, including React Data Grid, Blazer Data Grid, Angular Data Grid, JQuery Data Grid, ASP.NET MVC Data Grid, and more. ApexCharts features a best-in-use and intuitive API for better branding and theming so that you can bind to data quickly with less coding. It helps developers to build interactive and beautiful visualizations of charts of dashboards. Choose from a variety of chart types, styles, and colors. Your charts can work on desktops, mobiles, and tablets. ApexCharts is an easy-to-use standard that helps you quickly set up the charts.
AnyChart
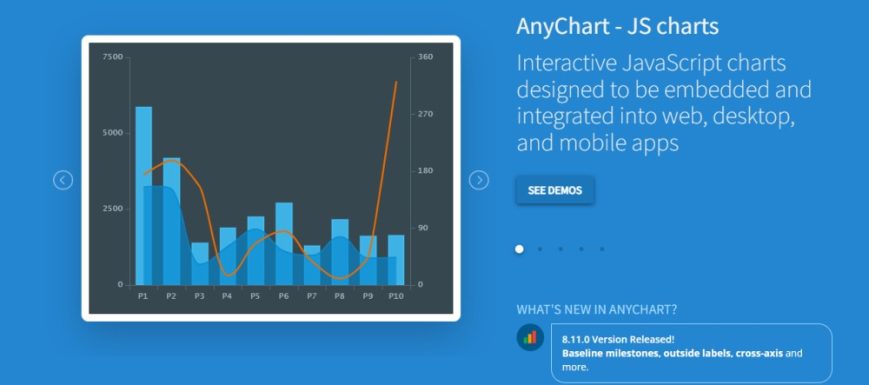
AnyChart provides interactive javaScript charts, which you can embed further in your business applications or websites. You can also add interactive map charts with routes and drill-downs. With AnyGantt, you will get robust HTML5 Gantt, PERT, and resource charts. If you are on the Qlik platform, you can add the AnyChart extension in your application to use directly on a single platform. Differentiate your web pages, application, and products with awesome dashboards and charts. Get a flexible JavaScript library for your data visualization needs. Choose from a variety of charts (column, line, bar, range column, pie and donut, Pareto charts, etc.), development stack (PHP, Node.js, Meteor, Angular, Qlik, jQuery, etc.), and data source (JSON, XML, MongoDB, MySQL, CSV, etc.) With AnyChart, you can find numerous features that add value to your charts, such as chart types, drawing tools, localization, themes, technical indicators, and more. Whether you need to enhance the website with embedded dashboards or better reporting or build a new product, AnyChart has everything for you.
JSCharting
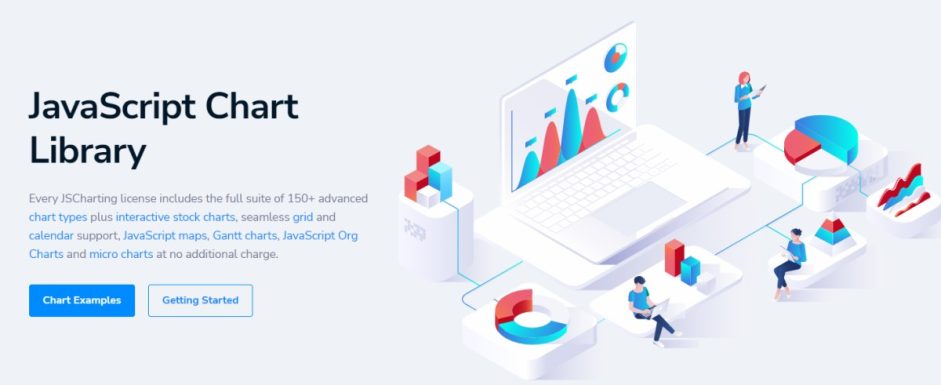
When you buy a JSCharting license, you will get more than 150 advanced chart types, interactive stock charts, calendar support, Gantt charts, micro charts, JavaScript Org Charts, JavaScript maps, and more. Find the best chart from various options and start building your own dashboard. Charts include lines, advanced combination types, stock charts, donuts, pies, scatter charts, bar and column charts, step lines, splines, etc. JSCharting offers never-ending features to meet your modern requirements, from internationalization and globalization to interactivity, real-time, and visual results. Get a chart as per your need with an intuitive and simple API. JSCharting also covers stocks, maps, gauges, KPIs, Venn diagrams, Gantt charts, calendar charts, and more. It renders cleanly on every device, from smartphones to desktops, via native vector SVG that always gives you the best performance.
amCharts
Get a programming library for all your data visualization needs with amCharts. Its charts give you sleek, fast, modern, and out-of-the-box design. amCharts integrates with Angular, plain JavaScript, Vue, Angular, and TypeScript. Build times zones, gapless date axes, Venn diagrams, column stacks, and many more with amCharts. When you do not have time to understand new tech, you need a powerful, simple, and flexible data visualization solution. It uses Canvas API, which is faster than SVG in most cases, in order to build a DOM tree faster for better rendering. Data processing in amCharts is an efficient solution, and amCharts makes your data processing fast with updates, lightweight data, and repetitive aggregations.
CanvasJS
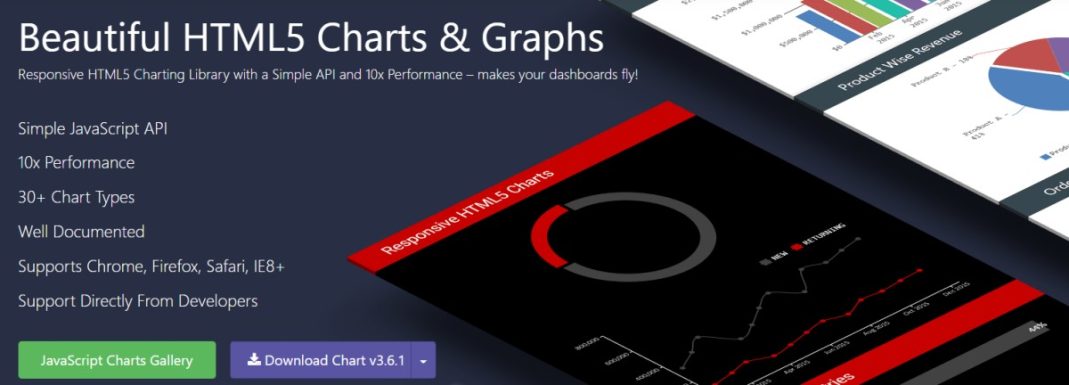
Get awesome HTML5 graphs and charts for your next application dashboard project with CanvasJS. It offers 10x performance, over 30 chart types, well documented, and a simple API for you. It supports Firefox, IE8+, Safari, Chrome, and devices like Android, iPad, iPhone, PC, and Mac. You will get features like themes, chart types, interactivity, multiple axes, stock chart, dynamic chart, logarithmic axes, zooming, and panning. Create rich dashboards that work well across devices without lacking in functionality and maintainability of your application. You will get several good-looking and faster themes, resulting in beautiful, responsive, and lightweight dashboards.
billboard.js
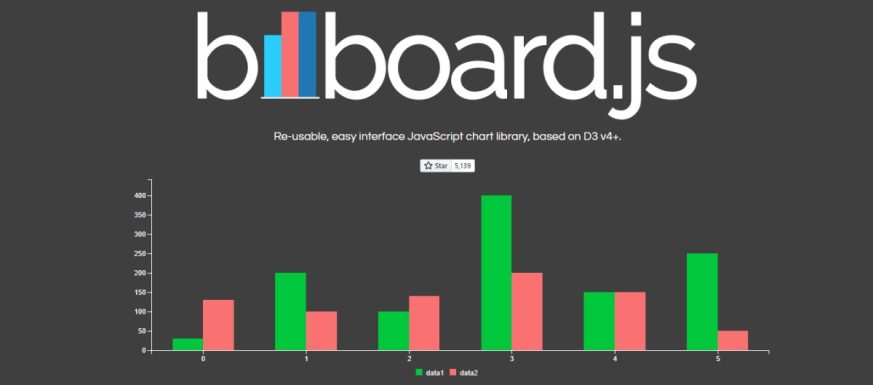
billboard.js is a reusable and easy-interface JavaScript library based on D3. It provides the easiest way to build charts for your application dashboard. Follow simple steps to install billboard.js in your system. Install billboard.js and D3.js, set up the chart holder as per your requirement, and generate the chart with various options to enjoy perfect data visualization. With the help of extensive features and functionalities, you can quickly build charts. All the code in billboard.js is written in ES Module with ES6+ syntax. You can combine each option as per your need and get the best result.
Conclusion
Data analysis and visualization are becoming essential for businesses. Therefore, you require interactive and clear methods of interpreting data. Using charts and graphs in your application’s dashboard will help you represent your data clearly. It will enable businesses and developers to know key metrics, make appropriate decisions on time, and improve results. And if you want to build such a dashboard with beautiful charts and graphs, choose the wonderful libraries mentioned above based on your business needs. It will help enhance the data visualization for your sites and applications.

![]()

